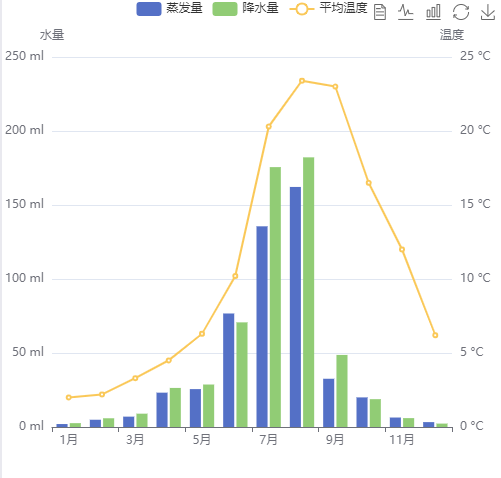
本教程目的在于让大家熟悉并掌握ECharts的使用。目前ECharts支持Web版本和App版本(注:需要使用6.2及以上版本的designer)。以下示例为折柱混合图,更多代码示例见:SmobilerTutorials
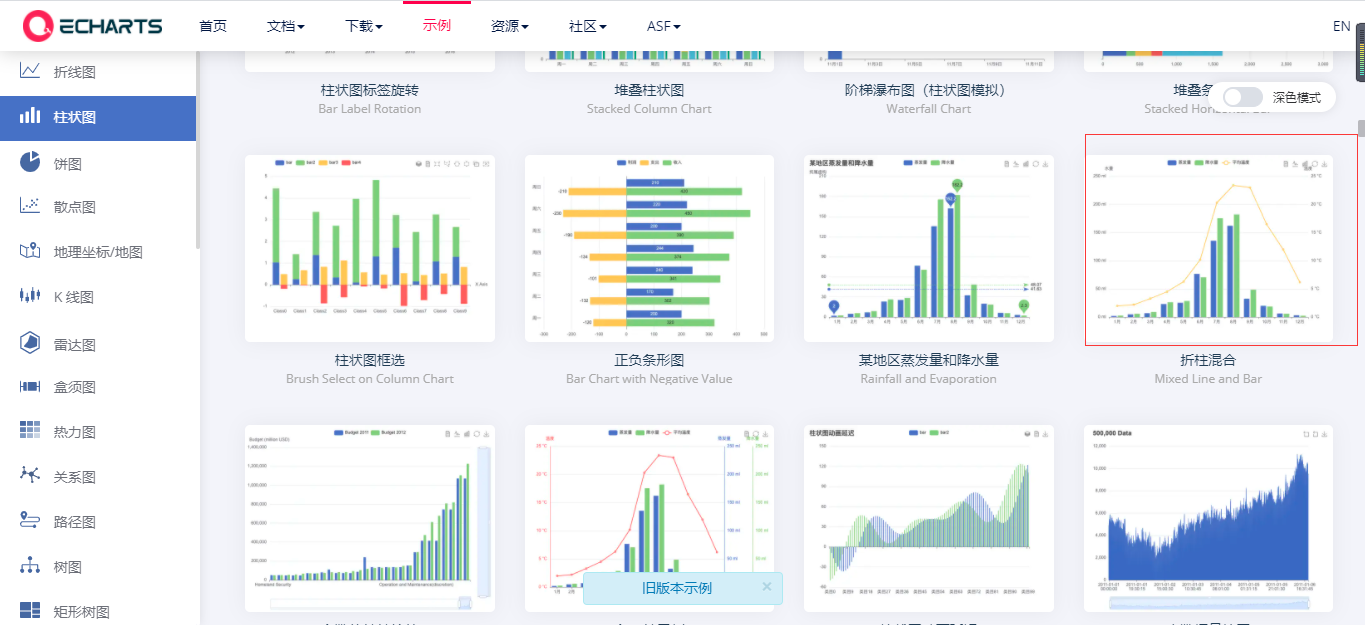
Step 1.打开https://echarts.apache.org/examples/zh/index.html ,找到折柱混合图,点击查看代码
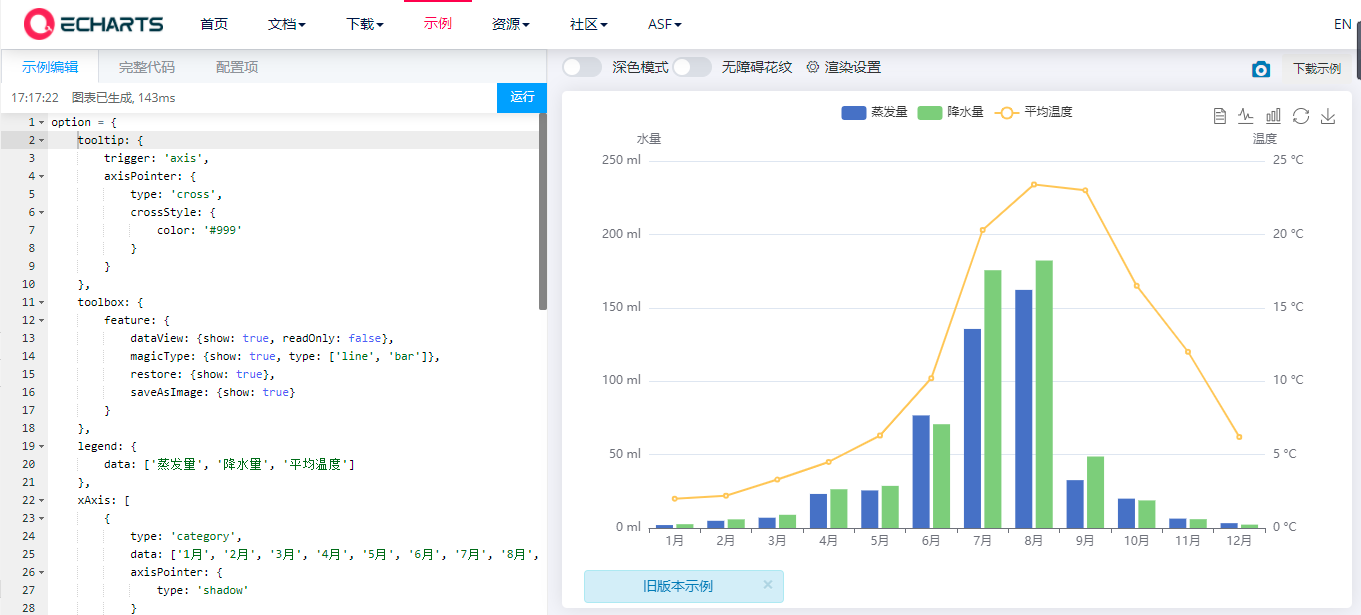
Step 2.复制Echart网站上的代码(option部分代码)
Step 3.新建窗体,在窗体中加入Button控件和ECharts组件,将复制的代码粘贴到eCharts1.Option属性,代码如下:
C#:
    private void button1_Press(object sender,EventArgs e){
            eCharts1.Option = @"{
            tooltip: {
                trigger: 'axis',
                axisPointer: {
                    type: 'cross',
                    crossStyle: {
                        color: '#999'
                    }
                }
            },
            toolbox: {
                feature: {
                    dataView: {show: true, readOnly: false},
                    magicType: {show: true, type: ['line', 'bar']},
                    restore: {show: true},
                    saveAsImage: {show: true}
                }
            },
            legend: {
                data: ['蒸发量', '降水量', '平均温度']
            },
            xAxis: [
                {
                    type: 'category',
                    data: ['1月', '2月', '3月', '4月', '5月', '6月', '7月', '8月', '9月', '10月', '11月', '12月'],
                    axisPointer: {
                        type: 'shadow'
                    }
                }
            ],
            yAxis: [
                {
                    type: 'value',
                    name: '水量',
                    min: 0,
                    max: 250,
                    interval: 50,
                    axisLabel: {
                        formatter: '{value} ml'
                    }
                },
                {
                    type: 'value',
                    name: '温度',
                    min: 0,
                    max: 25,
                    interval: 5,
                    axisLabel: {
                        formatter: '{value} °C'
                    }
                }
            ],
            series: [
                {
                    name: '蒸发量',
                    type: 'bar',
                    data: [2.0, 4.9, 7.0, 23.2, 25.6, 76.7, 135.6, 162.2, 32.6, 20.0, 6.4, 3.3]
                },
                {
                    name: '降水量',
                    type: 'bar',
                    data: [2.6, 5.9, 9.0, 26.4, 28.7, 70.7, 175.6, 182.2, 48.7, 18.8, 6.0, 2.3]
                },
                {
                    name: '平均温度',
                    type: 'line',
                    yAxisIndex: 1,
                    data: [2.0, 2.2, 3.3, 4.5, 6.3, 10.2, 20.3, 23.4, 23.0, 16.5, 12.0, 6.2]
                }
            ]
        }";
        }
运行之后,点击button,即可看到效果